
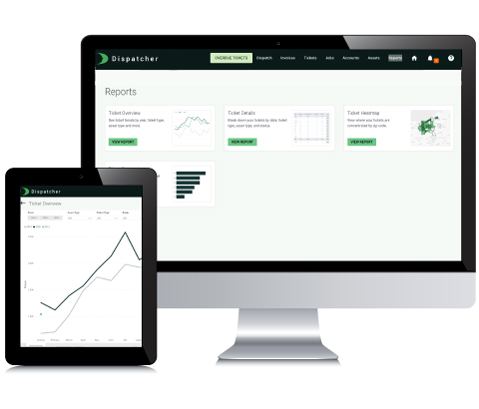
Reporting to Drive Your Operation
With our high-visibility reporting technology, you can see exactly how long an asset has been on a specific site and keep track of your idle roll off containers. Use these daily reports to minimize the amount of time your assets aren’t contributing to your company’s cash flow.
Stay up-to-date on your current ticket reports with easy access to information such as locations, clients and more within the web application. Plus, our filtering tools give you the power to customize your reports so you can find what you need, when you need it.
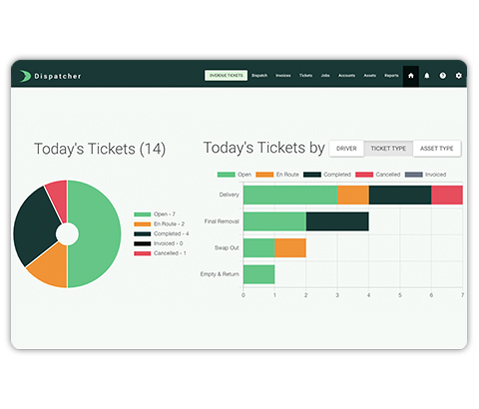
Daily Dashboard
View each driver’s daily tickets on the home screen to track activities, see who has completed deliveries and determine who is available for new jobs. You can also see if a driver is near a site in the live dispatch map to schedule container pickups seamlessly.
For more insights into your work orders, sort daily jobs by type. You can monitor which jobs are:
- Open
- En route
- Completed
- Invoiced
- Cancelled
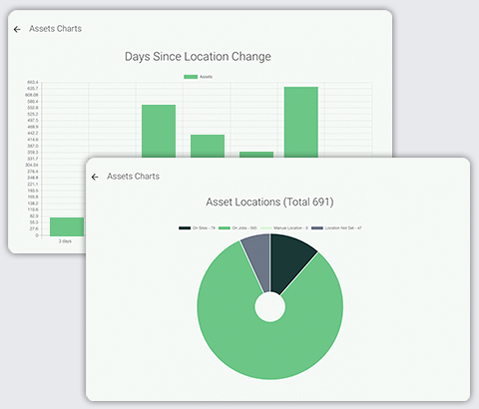
Inventory Management
For more in-depth analytics, use the asset charts to determine the locations of all your equipment or the days since the last location update to schedule upcoming pickups. Our asset location chart shows you whether your equipment is at a storage yard or on a job site.
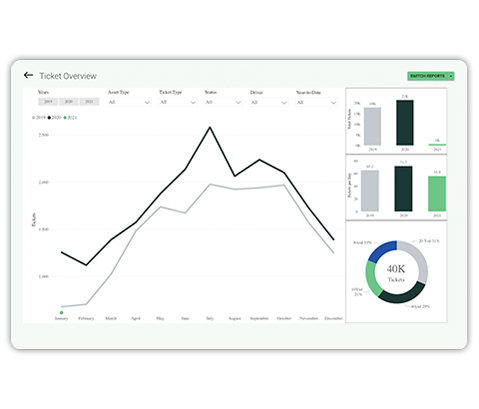
Ticket Reports
NEW ticket reports provide even further information about your work orders. Use our ticket details report to view your tickets by date, ticket type, asset type and status to have accurate numbers for all aspects of your hauling operation.
Get a high-level overview of the overall health of your business with the ticket overview report, which helps to uncover trends by year, ticket type, etc.
You can also track yearly asset trends to see which asset types your customers use most often so you can invest in new equipment and make other data-driven decisions for your business.
See How Dispatcher.com Can Power Your Hauling Business
Request a Demo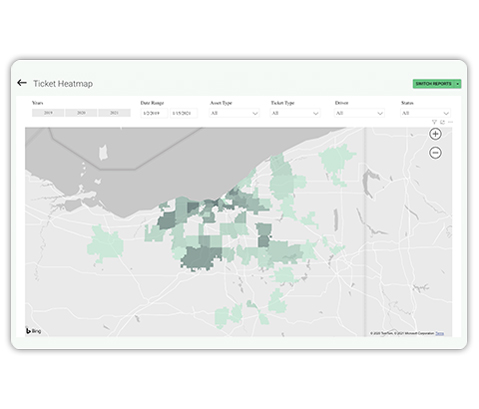
Ticket Heatmap
The NEW ticket heatmap helps you understand which regions you’re covering and the distribution of tickets by zip code. You can filter by ticket type, asset type, driver and more. Use this report to tell which zip codes have the most tickets with a single glance.
You’ll come away with insights about ways to route your drivers, where you do your most business and areas to explore for future rental business opportunities.
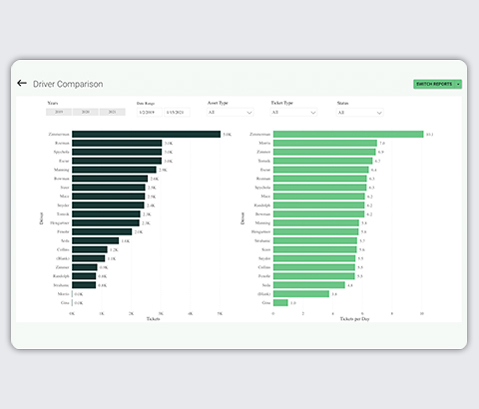
Driver Comparison Report
Use the NEW driver comparison report to see how productive your drivers are on a daily, monthly or yearly basis. This is measured via completed tickets they log in the mobile app.
This report provides ticket metrics that help you easily measure each driver’s performance. You can filter down to one specific driver or compare your entire team at a glance.
Use Optimized Reporting to Improve Your Business
Take charge of your assets, drivers and tickets with our intuitive reports. Try our software today to see how we can help you keep your business running smoothly.
Request a Demo